


Building up and launching a product or service from scratch can not only be difficult, it's goddam scary from start to finish. Unless you've been in that position, you won't truly comprehend the polar feelings between excitement and fear.
We will give an insight into some of the tools we use to help ease any feelings of fear, as well as distinguish how we plan, and set out to measure effectiveness from the beginning for our clients.
Putting all else aside (budget and timeframe), you should consider the overall direction you want your product or service to take. In Sugar Rush Creative, the first thing we advise clients to do is to outline short, medium and long-term goals in order for them to keep advancing their product or service and maintain positive momentum.
The former Top Gear presenters Richard Hammond and James May emotionally and physically sum up the principal of what you want to avoid when you're at an early stage like this.
OK, you may not be launching a Robin Reliant car in the hope it would make for a viable space shuttle anytime soon. However, like many startups, they blindly launch with the anticipation that their product or service will take off and become a success the first time of asking without any effective planning, precautions, fallbacks or meaningful research.
Unfortunately, according to Forbes business magazine, the hard and desolate truth is "90% of startups fail" and inevitably end like this experiment carried out by Top Gear.
But, you should not shy away from this statistic and in fact, work smarter to make sure you are in the successful 10%.
Propelling yourself into the successful 10%
We are advocates here in the studio of all things Google offers including Analytics, Search Console, Event Tracking and PageSpeed tests as you may already be aware of. These tools are free and when used effectively can provide you with critical feedback and evidence you need to make necessary updates and changes before or after you set a project live. We advocate these so much we never let a project go live without having vigorously gone through, including at least one if not more or all when possible.
Another string to add to this bow is heatmaps, mouse tracking, scroll tracking, click tracking and video recordings. Many different services offer these as a paid for package so they usually come together when you're signed up.
Collectively with each of these tools combined working alongside Googles tools, a solid foundation can be laid out for a new product or service developing online from the very beginning. Often startups are in such a rush to have something live they overlook this vitally important final phase before pushing the launch button. Resulting in their Robin Reliant Car plummeting to the ground head first from 200 metres.
Planning from the outset to measure the effectiveness of your product or service is crucial using these tools. In Sugar Rush, we hone in on every single inch advantage we can for our clients so that any feelings of fear when launching are minimised and replaced with a reassurance that all aspects are covered, and can be reviewed at the start of phase 2 or as part of your medium and long-term goals.
We see a huge benefit in including heatmaps, mouse tracking, scroll tracking, click tracking and video recordings when possible and wouldn't recommend it to clients unless we practised it ourselves. After testing out a few different services that combined analytics with feedback and provided this package we found the most reliable and effective was Hotjar . Let's have a look...
Heatmaps, Mouse Tracking, Scroll Tracking & Click Tracking
Highlights what users want, care about and do on your product or service by visually representing their clicks, taps and scrolling behaviour across desktop, tablet and mobile - which are the strongest indicators of visitor motivations and desires. The red coloured areas indicate the positions with highest user interactions compared to the navy/blue coloured areas with the lowest user interactions.
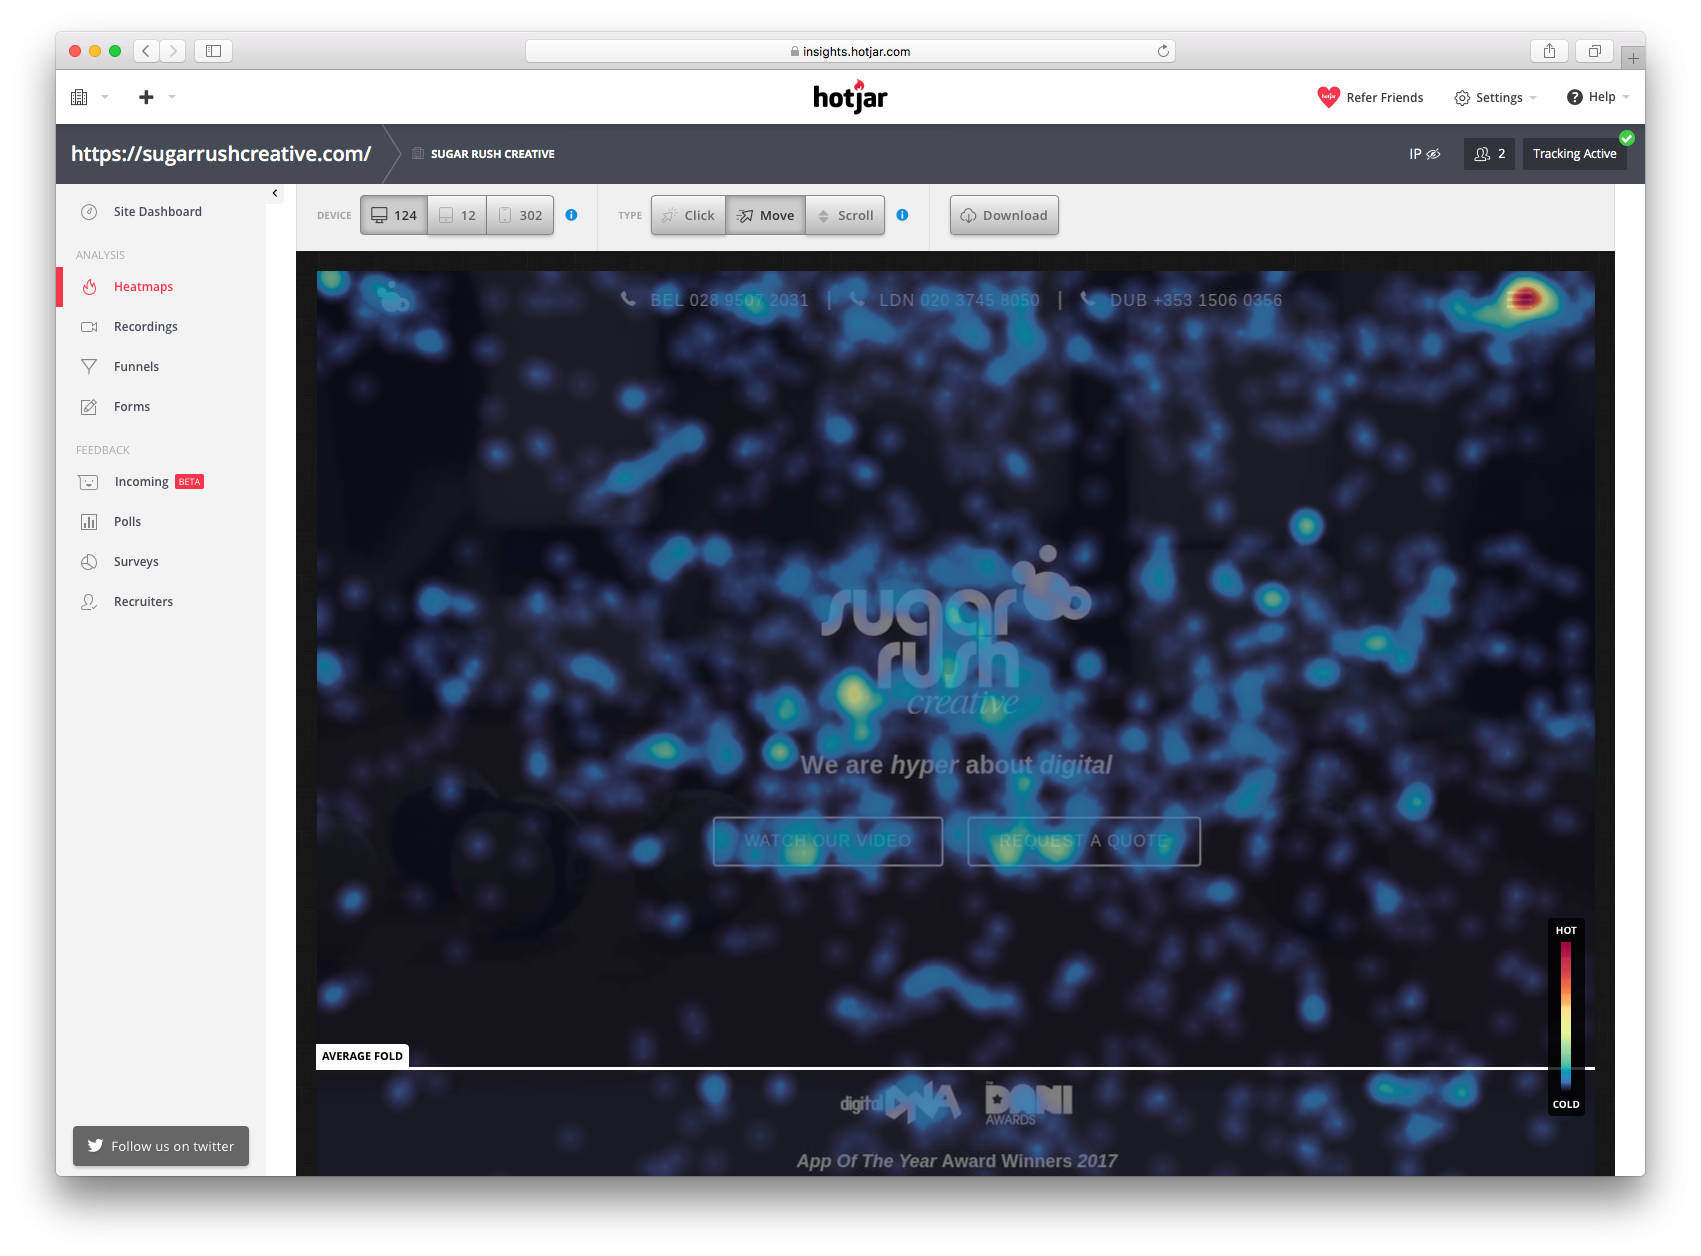
A Screenshot showing the Heatmap of users mouse position on the Sugar Rush Creative homepage
A screenshot indicating the user Click Tracking
A screenshot of the users Scroll position tracking after loading the homepage
Video Recordings
Highlights what users want, care about and do on your product or service by visually representing their clicks, taps and scrolling behaviour across desktop, tablet and mobile - which are the strongest indicators of visitor motivations and desires. The red coloured areas indicate the positions with highest user interactions compared to the navy/blue coloured areas with the lowest user interactions.
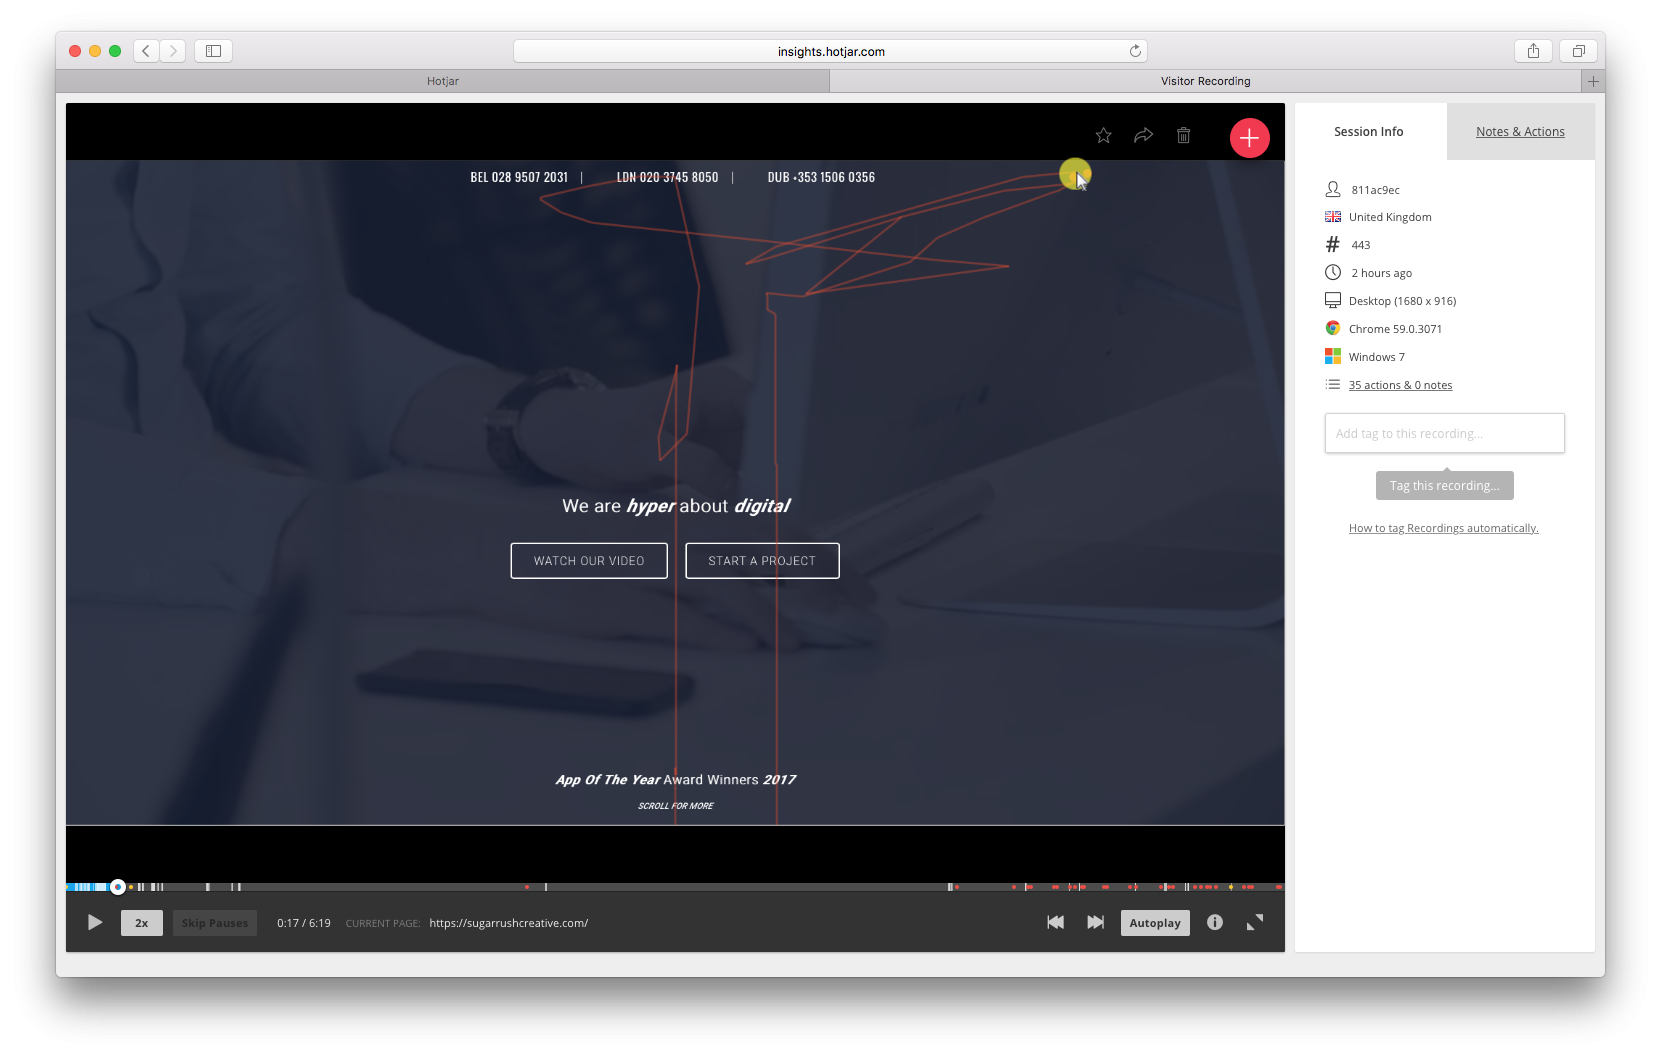
A screenshot of user's mouse movement during the video recording of their website visit
We have rigorously tested out the analytics and feedback tools on our own website and can confirm that with Hotjar, you can truly understand your web and mobile site visitors by seeing how they interact with your pages and by understanding why they behave the way they do. This allowed us to quickly identify opportunities for improvement and growth in the hope of increasing the ROI.
These tools are not an alternative to Google Analytics, they and services like Hotjar should be used alongside each other with one complimenting the other.
Google Analytics reports that your homepage has a very high bounce rate. Hotjar will tell you exactly why that is happening allowing you to make the changes needed to decrease bounce rate.
After spending a brief time exploring the potential a service like Hotjar is capable of presenting, it's clear that this is only a scratch on the surface as to how much benefit a user or client could gain. As analytics and feedback grow, we can see tools like this gaining big traction on the market in the coming months and years.
Conclusion
So, if you are wanting to start or you're in the early stages of beginning work on a product or service, our tip is to make dam sure you are considering how you will plan and measure how effective your project will be when you reach phase 2.
Whether that is the inclusion of powerful tools like Google Analytics (or an equivalent tool) or the next level of analytics and feedback like Heatmaps, Mouse Tracking and Scroll Tracking, the enormous amounts of information that can be gathered from these, could be the difference between your Robin Reliant car becoming a space shuttle or a firework.
You decide...
If you would like to begin a journey and start off your project planning and measuring its' effectiveness, then get in touch to discuss your options.